
Millions are spent every year on brand valuation rankings. They are a nice reminder that brands are a valuable corporate asset. But they produce wildly different results, even for the same brand. For example, take a look at four of the most popular annual rankings:
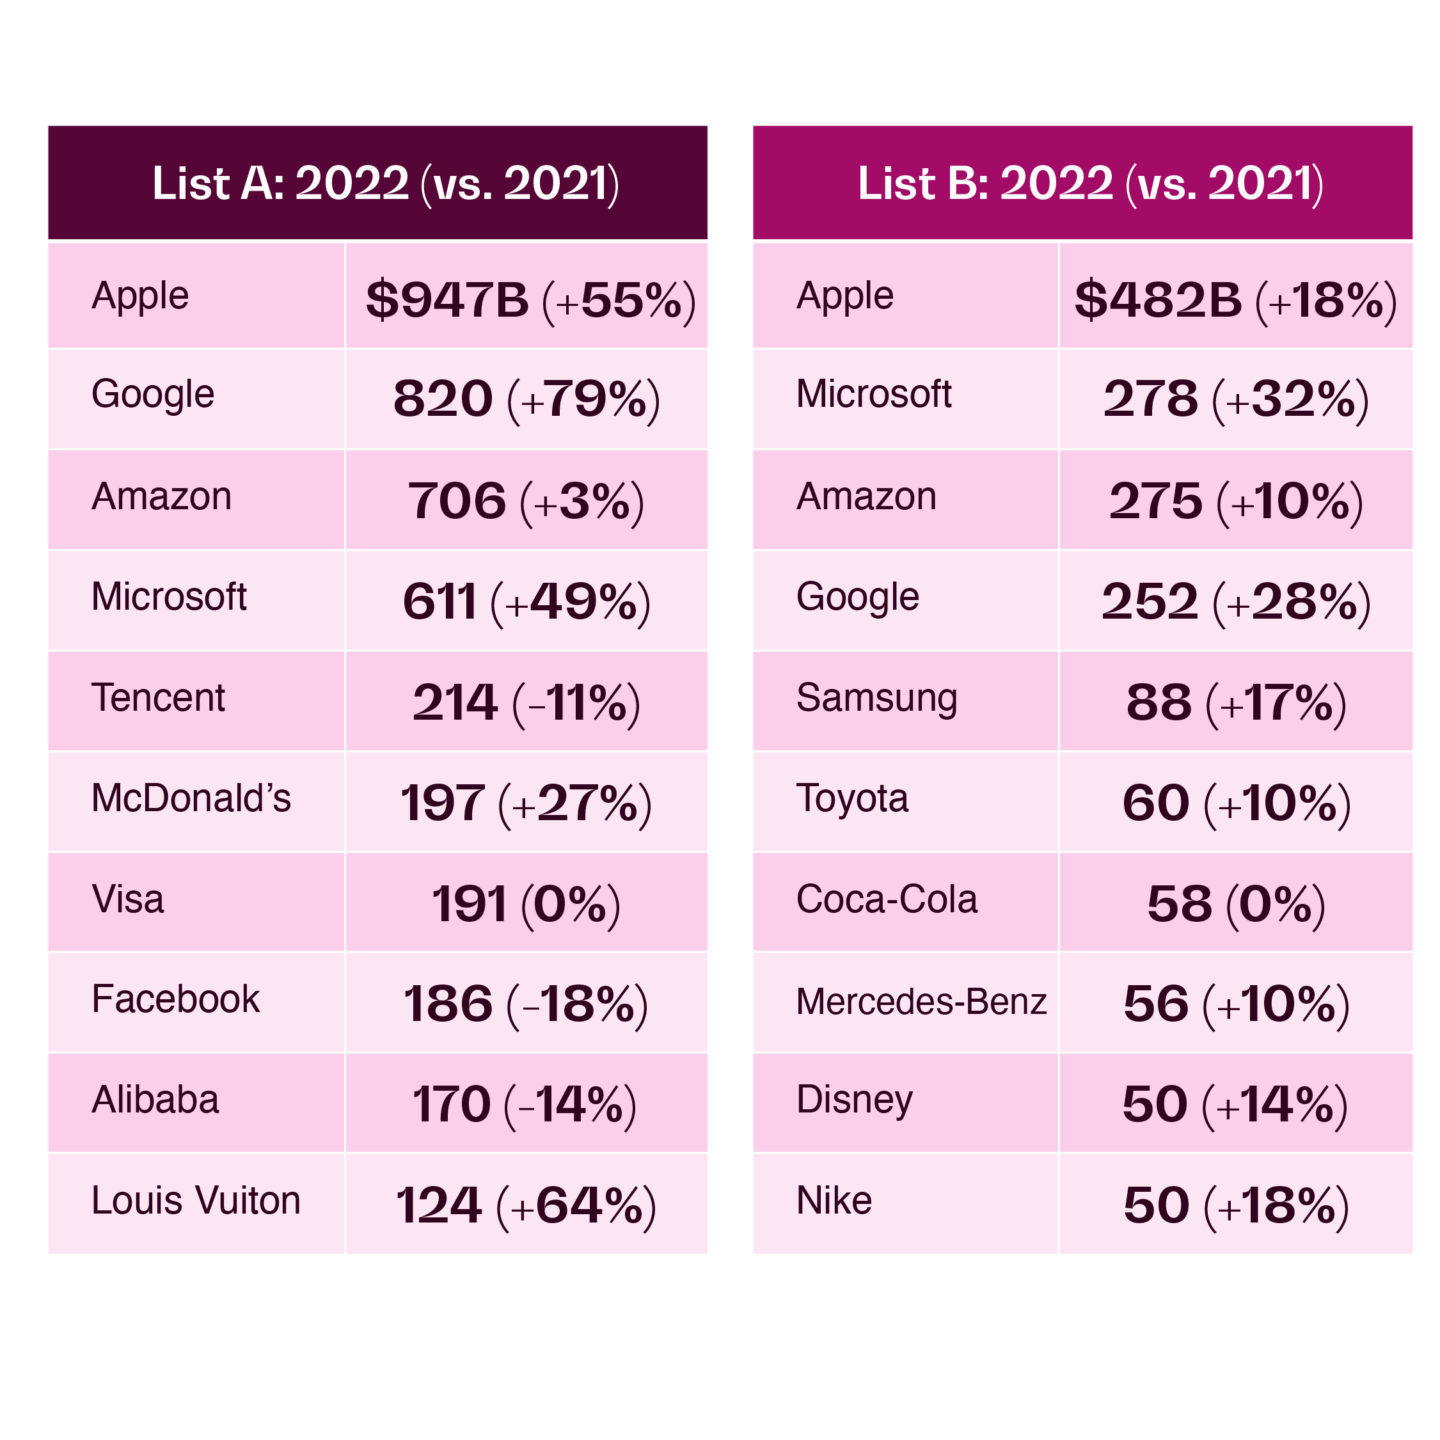
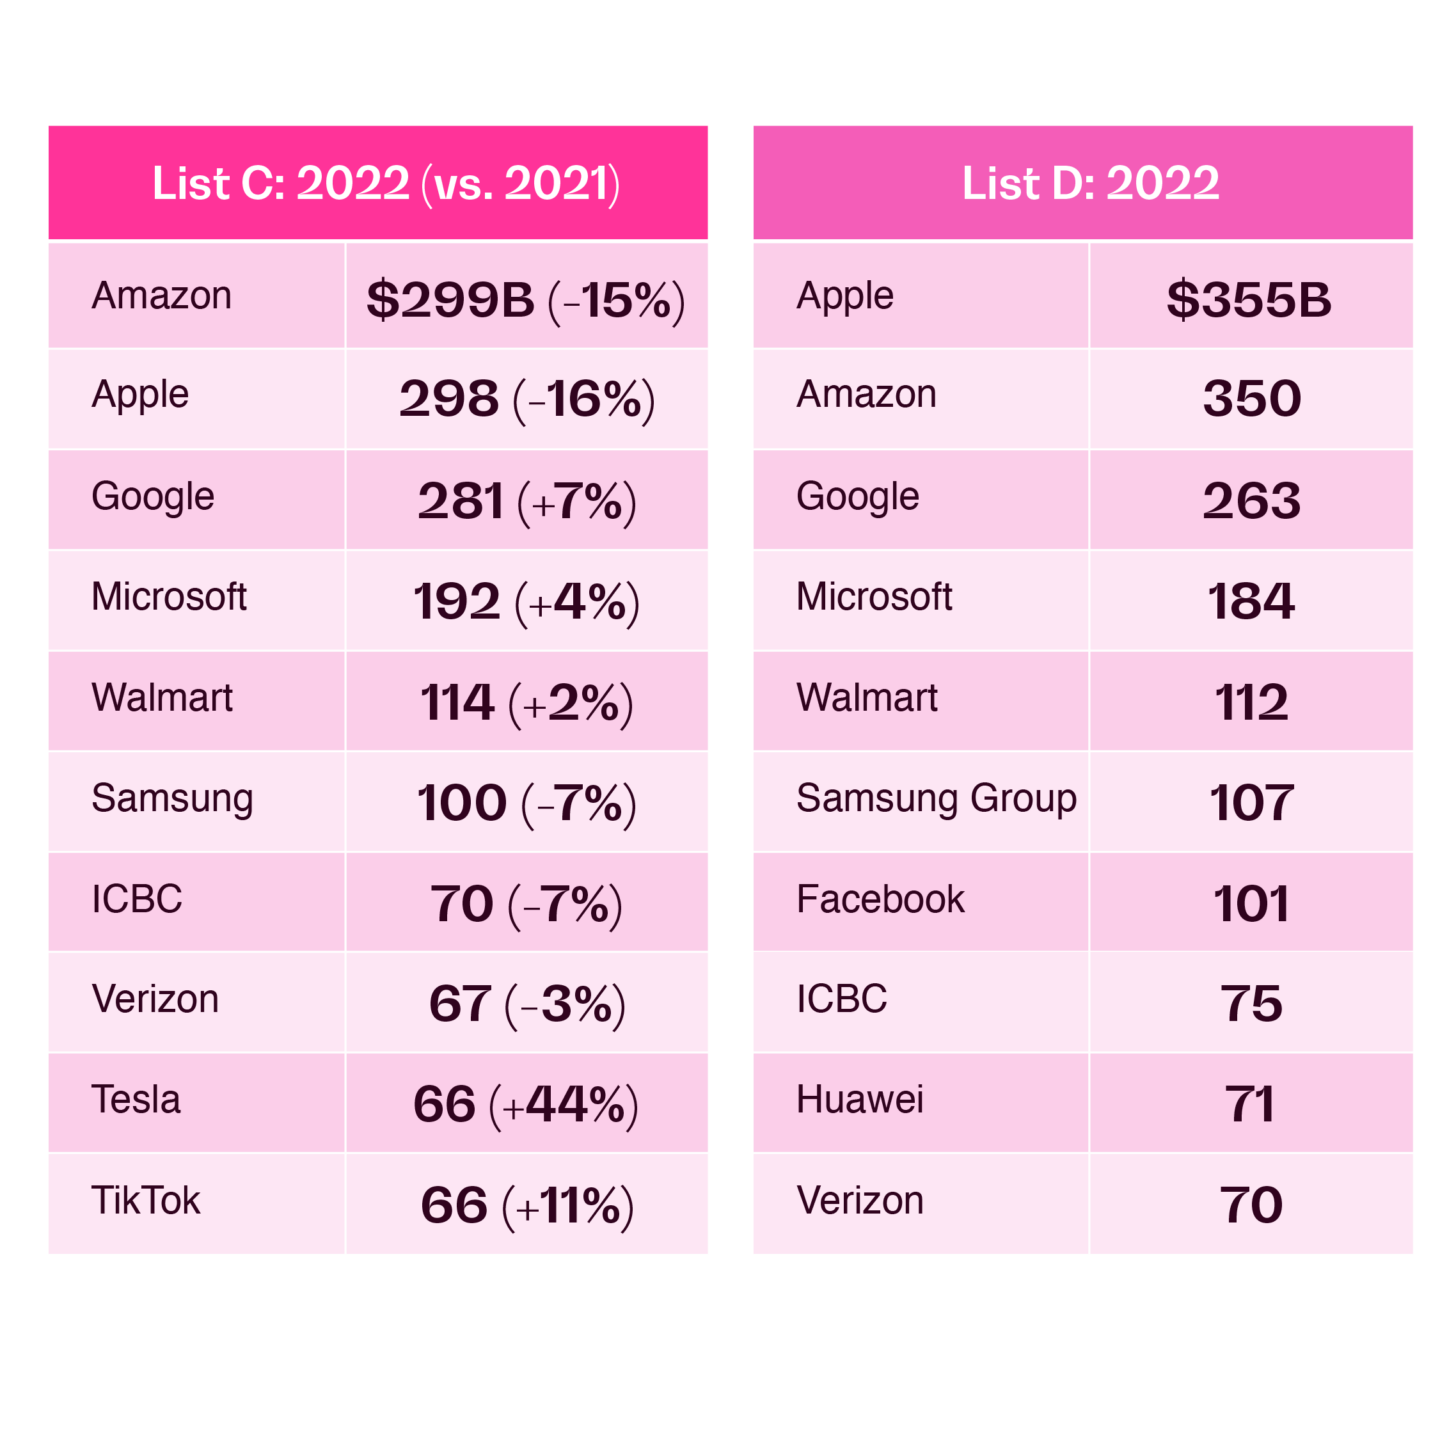
Four brands make every list: Apple, Google, Microsoft, and Amazon. But note the range of valuations. On one list Apple’s brand value is almost a trillion dollars. On another it’s barely a quarter of that. According to List A, Apple’s brand value increased by 55%; but in List C it fell by 16%. It’s hard to believe that in just a year, Apple’s brand equity changed that much in either direction.
Once you get beyond the big four, the lists impressively diverge from each other. Of the 17 other brands, only one (Samsung) made three of the four lists and a mere four (Facebook, Walmart, ICBC, and Verizon) made two. The rest—12 brands—made only one of the four Top 10 rankings.
What are brand owners to make of these results? More importantly, what are they supposed to do with them? We will get to these questions, but first we have to address a more foundational one.
Why measure brand valuation at all?
A BERA mantra is that measurement should help leaders make better decisions. It might be fun and interesting to know that a brand is worth this or that, but what decisions does measuring brand value inform for the owner of a brand?
The answer is none if it depends on subjective financial metrics like “intangible asset ratios” and “earnings attribution rates,” and on brand metrics with no predictive linkage to those financial metrics. The results end up being in the eye of the beholder, which is why they vary so much from beholder to beholder in the table above.
Moreover, the methodologies behind the most popular rankings typically require detailed income statements and balance sheets that aren’t typically available even internally for brands that don’t carry their parent company’s name, like Pampers, Chevrolet, Gillette, M&Ms, and hundreds of others. That’s why brands like these are absent from annual rankings, even though they are among the most important or popular brands in the world.
Annual rankings are entertaining, but we clearly need an approach to brand valuation that is useful for decision making, and which can be used for all brands, including:
- corporate, product, and service brands.
- public and privately-held brands.
- B2C and B2B brands.
Actionable brand valuation
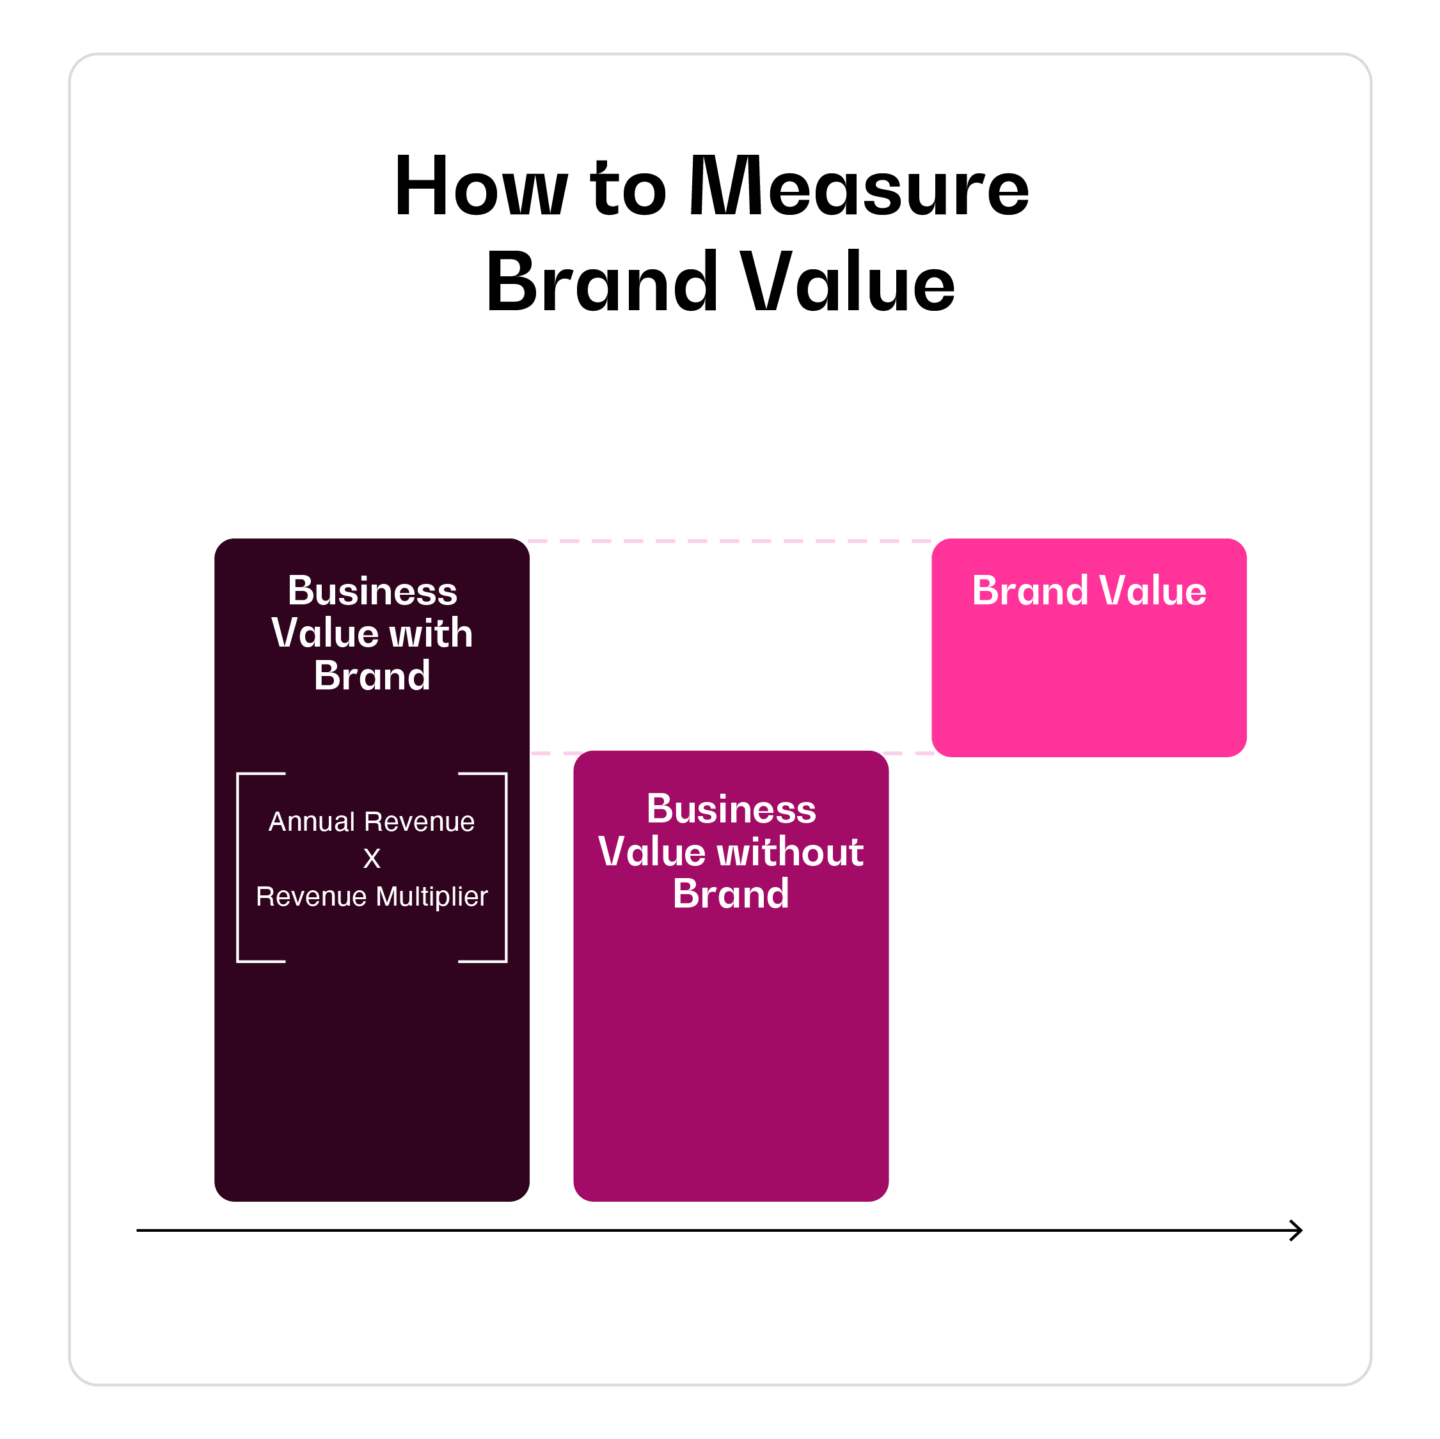
We recommend starting with a simple conceptual framework to measure brand value correctly:
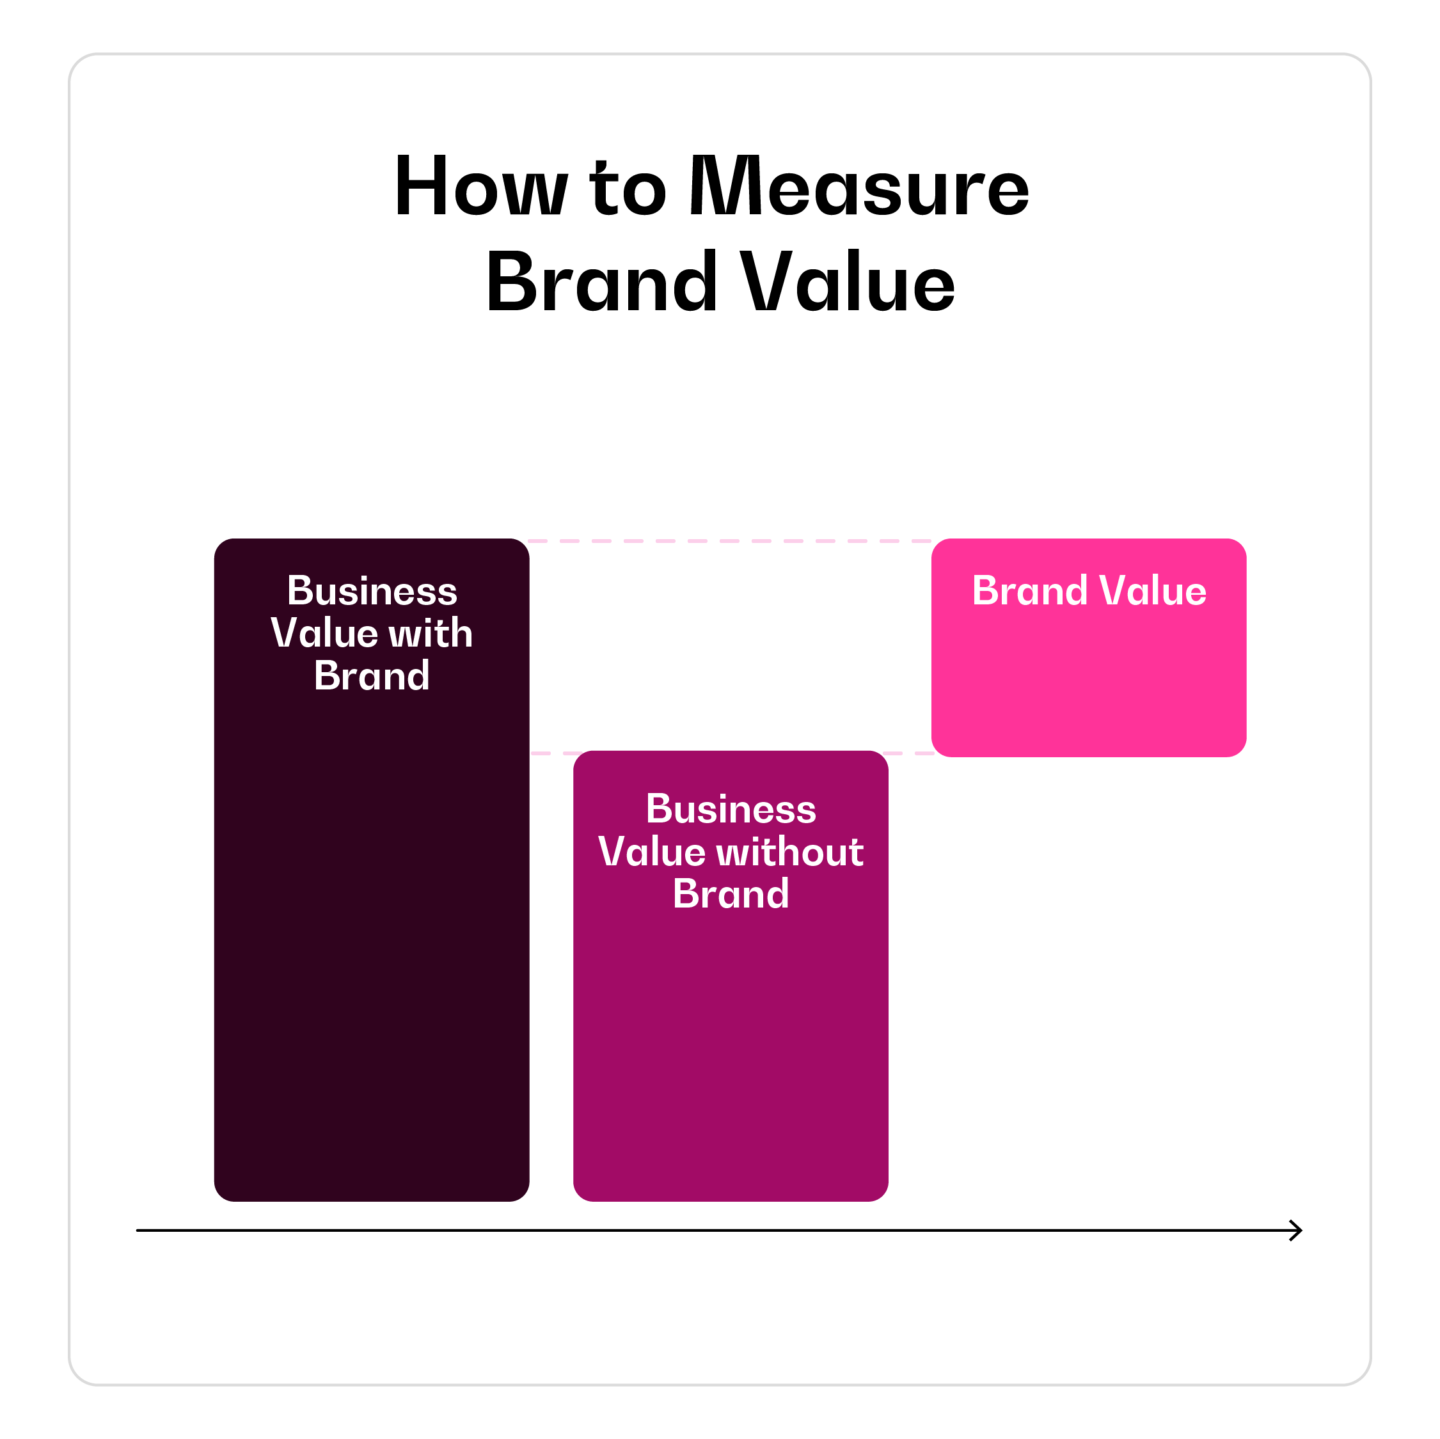
For example, we have to figure out the value of the Pampers business with the Pampers brand (first bar) and without it (middle bar) to measure the value of the Pampers brand (the last bar).
Measuring business value with brand
Finance professors and CFOs are used to measuring business value by forecasting expected future cash flows and discounting them by a cost of capital to calculate a net present value. Investors like to measure business value by applying an earnings multiple, often referred to as a PE ratio or Price-to-Earnings Multiple, to current earnings. But marketers and brand managers relate more to sales because this is typically central to their mandate.
We recommend calculating business value as the product of two variables:
Business Value = Annual Revenue X Revenue Multiplier
For example, the value of a business is $150M if its annual sales are $100M and its revenue multiplier is 1.5.
Tim Cook, the CEO of Apple, doesn’t have to use this equation because he can calculate the value of his business by using Apple’s stock price. But we don’t have a stock price for businesses such as the Pampers business at P&G and Mars, the privately-held food company. We have to use the equation above for brands like these and that means we need a way to objectively estimate revenue multipliers.
Estimating revenue multipliers
BERA maintains a continuously updated database on the mean, median, and distribution of revenue multipliers for 200 categories. Here’s a small subset of that database:
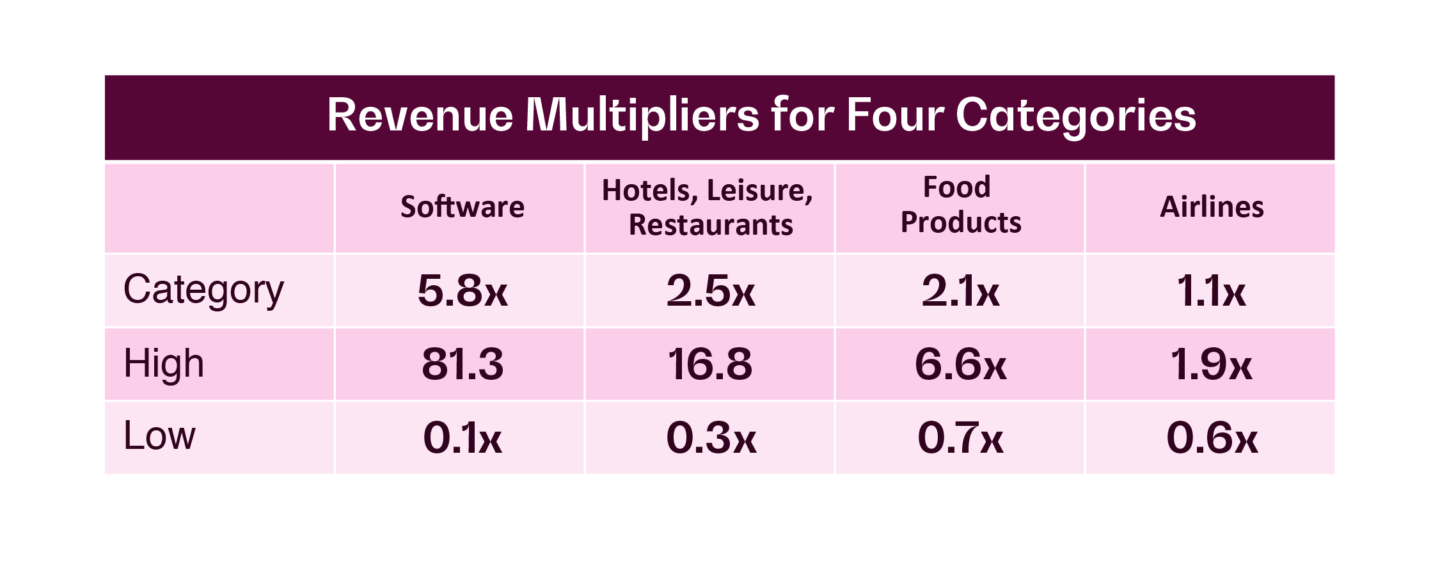
The revenue multiplier for each category is determined by its revenue quality—that is, the category’s expected future revenue growth, profitability, and stability. For example, software is a high-growth, high-margin category compared to airlines, hence its revenue multiplier is 5.8x versus only 1.1x for airlines. Clearly, then, category is a big determinant of every brand’s revenue multiplier.
But the table also shows that there’s a wide range of revenue multipliers within every category, as well. This is because revenue multipliers are driven by revenue quality, brand strength is the key driver of revenue quality, and the strength of brands within a category varies a lot.
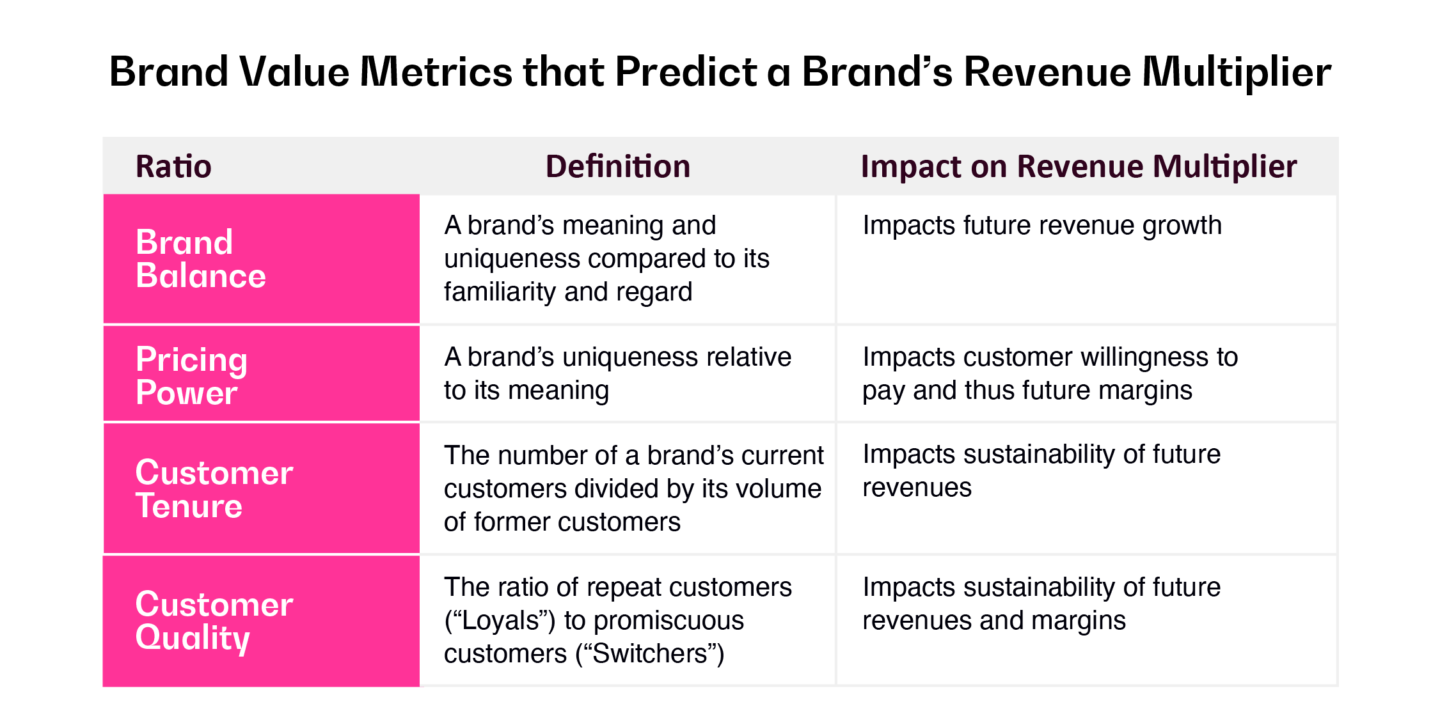
The BERA database on revenue multipliers is part of a much larger one with 130+ brand metrics for 4,000 brands across the same 200 categories. Through econometric modeling, we found that four brand metrics predict revenue multipliers:
BERA tested these metrics by applying them to a sample of 150 companies whose revenue multipliers are observable because they are publicly traded. The chart below shows the predicted and observed revenue multiplier for each company:
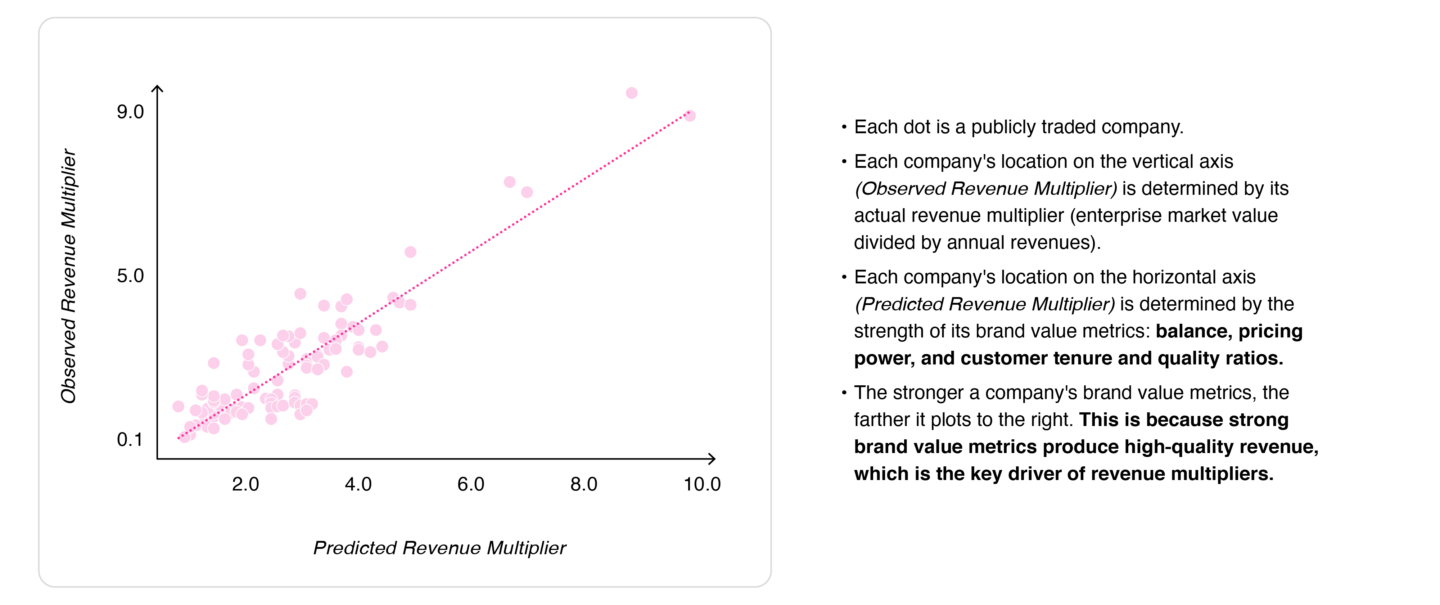
We can test the predictive power of the four brand value metrics by comparing predicted to actual revenue multipliers. As you can see in the chart, more than 80% of the variation in observed multipliers is explained by predicted multipliers and the four metrics that go into them. The fit is not perfect, but more than good enough for confident estimations.
Here is an example with three brands in the Food Products category:
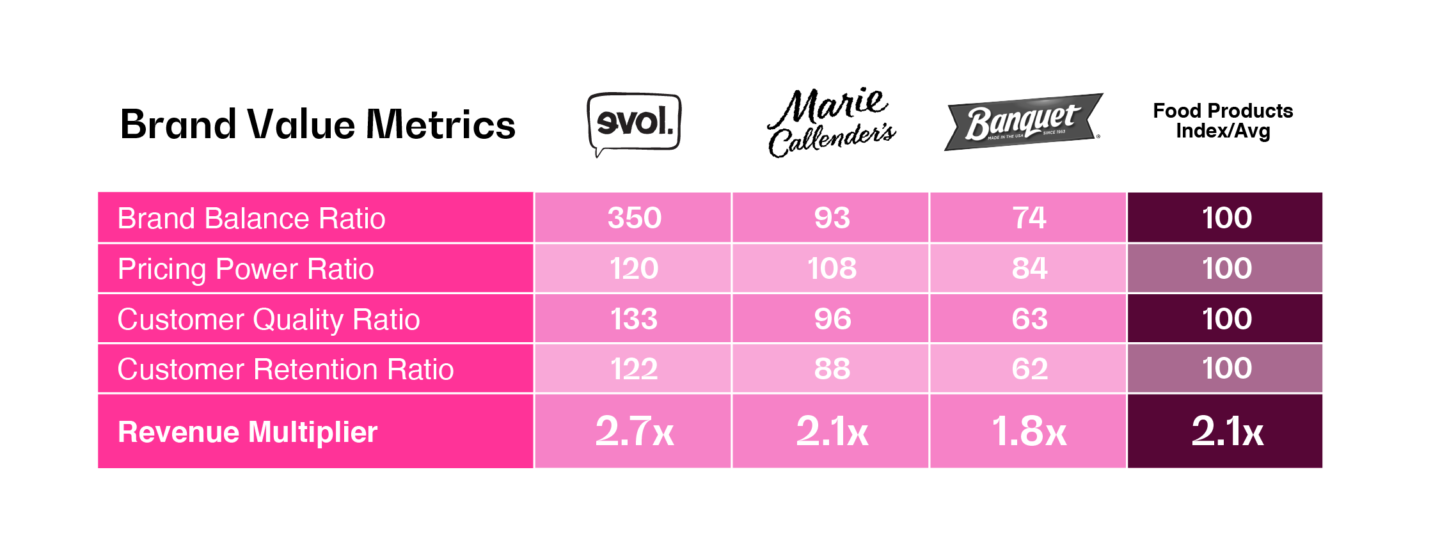
Banquet’s revenue multiplier of 1.8 is lower than its category average of 2.1 because its brand value metrics are uniformly lower than its category. The Evol brand “wins” on all four metrics and attracts a premium revenue multiplier (2.7 vs. 1.8) because those metrics indicate that Evol’s revenue quality is much higher than Banquet’s.
This methodology enables brand owners to confidently quantify the first bar in our conceptual framework without the need for detailed income statements, balance sheets, cash flow forecasts, and brand-attribution assumptions:
Importantly, brand owners can see what’s driving their revenue multipliers in their four brand value metrics and gain grounded, financially-savvy guidance on how to optimize their brands’ contribution to business value.
Measuring business value without brand
Filling in the second piece of the puzzle—the middle bar in the image above—requires us to be able to reliably estimate what the annual revenues and revenue multiplier of a business would be without the benefit (or drag) of their brand equity.
Measuring annual revenues without brand
For the 4,000 brands in BERA’s online brand management utility, we track:
- stated consumer purchase behavior (which has been independently validated to be 95% accurate of actual behavior).
- causal linkage between BERA’s brand equity metrics and consumers’ stated purchase behavior.
- causal linkage between BERA’s brand equity metrics and financial metrics, including annual revenues and shareholder value.
This enables owners of these brands to separate baseline purchase behavior from their brands’ effect on consumer behavior to quantify what their revenues would be without the contribution of their brand equity.
For example, a consumer services business applied this approach and found that its revenues would be almost a billion dollars lower—$7.0B vs. $7.8B—without the backing of its strong brand. In other words, more than 10% of its revenue is attributable to its brand.
This finding dovetails with the results of dozens of marketing mix models that use BERA brand data. These show that the attributable revenue contribution of brands when properly measured range from 5% to almost 40%, with an average of 15%.
Measuring revenue multiplier without brand
Recall that revenue multipliers are reliably estimated by four metrics: brand balance, pricing power, customer tenure, and quality. The same econometric model that creates this linkage can also help brand owners quantify what their revenue multipliers would be without the strengths or weaknesses of their brands.
Here’s what this approach produces for the consumer services business mentioned just above:
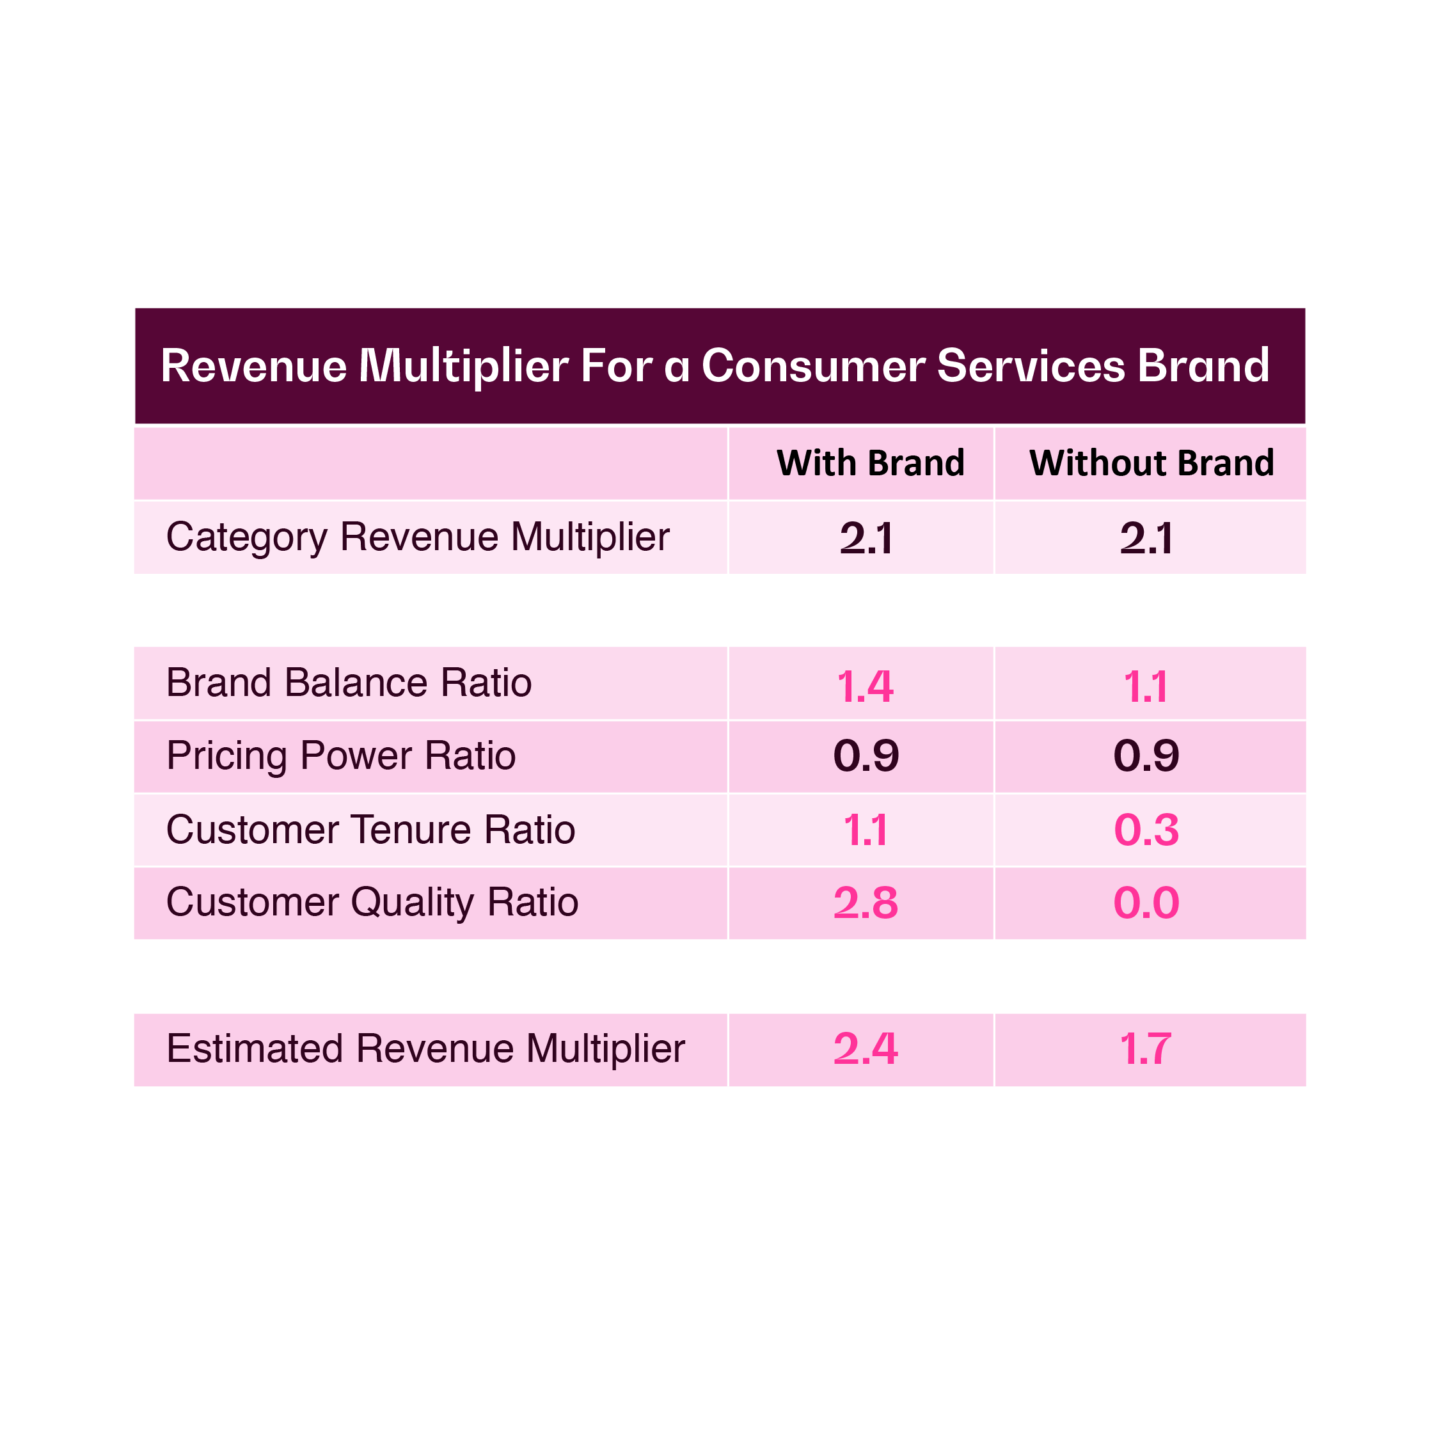
This shows that its revenue multiplier would be almost 29% lower—1.7 vs. 2.4—if not for a strong brand.
It also reveals why its brand contributes so much to its revenue multiplier: high meaning and uniqueness (balance ratio) and a sticky, loyal customer base (customer tenure and quality ratios). This is a recipe for stable revenues with strong growth momentum, which is a key driver of premium revenue multipliers.
Now we have the data needed to complete the calculation in our conceptual framework. This is what it looks like for the consumer services business:
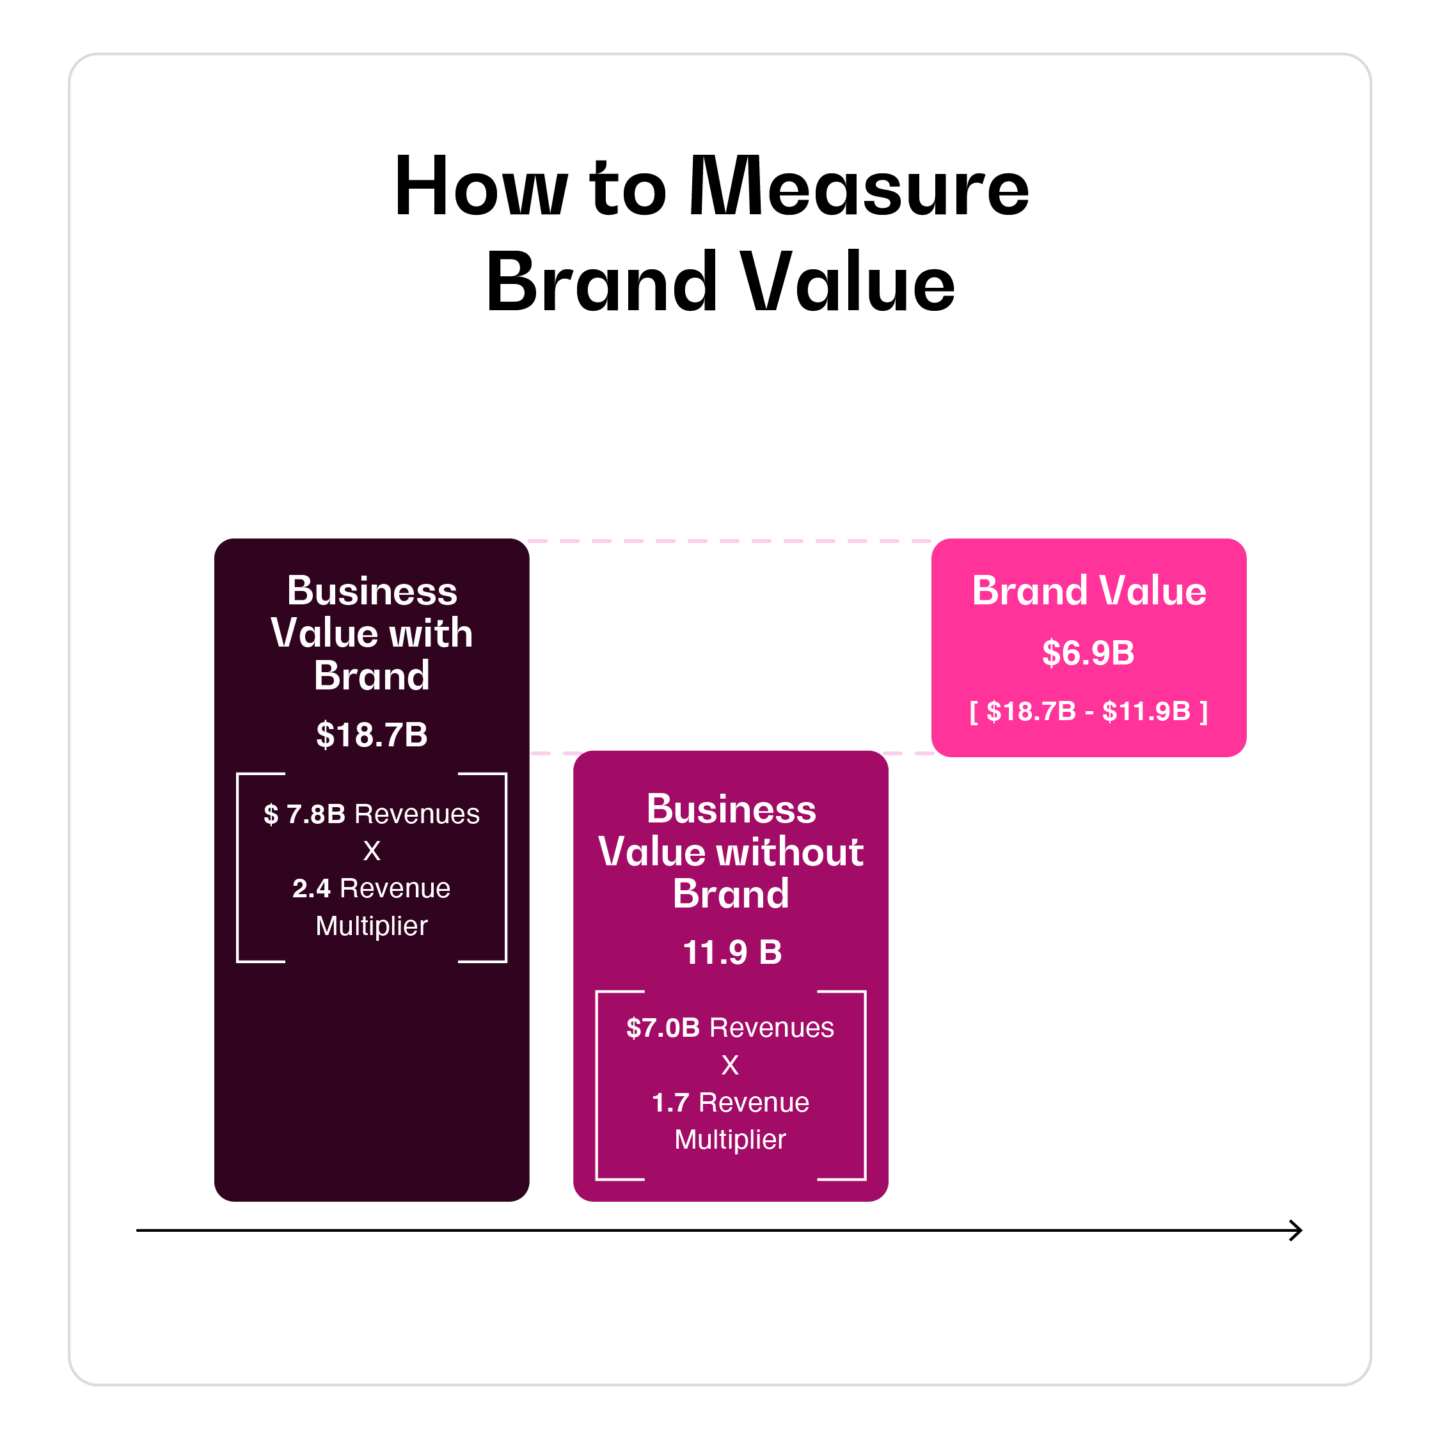
The strength of this business’s brand is responsible for more than a third of its value. And most of the brand’s value comes from its contribution to the business’ revenue multiplier! Less than 20 percent is from its contribution to current revenue. (Side note: this is why marketing mix models so understate the financial contribution of brands. They only measure contribution to revenue volume and miss the multiplier effect of brand equity on revenue quality.)
A handful of big advantages
Unlike the annual value rankings, this approach is completely objective. It doesn’t depend on the beholder. The data and analytics behind it are automated. No detailed financial statements are needed. No inevitably arbitrary forecasts and cost of capital assumptions are required. No subjective attribution of brand to earnings is necessary. No subjective split between tangible assets (property, plant, equipment, and so on) and intangible assets (IP, customer goodwill, or brands) has to be made, nor between brand assets and other kinds of intangible assets.
Another advantage is the power this approach gives marketers to measure brand value in terms—revenue and revenue multiplier—that they can relate to, and with a rigor that CFOs can buy into. Marketers don’t have to worry about things like “expected future cash flows,” “terminal values,” “WACC,” and “earnings attribution” to value their brands. And their financial brethren can be confident that the marketers are not just focused on revenue volume, but revenue quality, too (because, again, that is the key driver of a brand’s revenue multiplier).
A third advantage is that this approach can be applied within a brand; for example, by country, demographic, customers versus noncustomers, loyals versus switchers, and so on. All you need to know is a brand’s revenues and its brand valuation metrics by any of these cuts. This adds an important layer of visibility into what’s driving a brand’s value and how to grow it.
Finally, and perhaps most important of all, this approach doesn’t just produce an objective brand valuation, it also produces an objective fact-based explanation of the valuation from both an owner and customer perspective. For example, let’s return to the valuation of Apple’s brand, this time using our recommended approach:
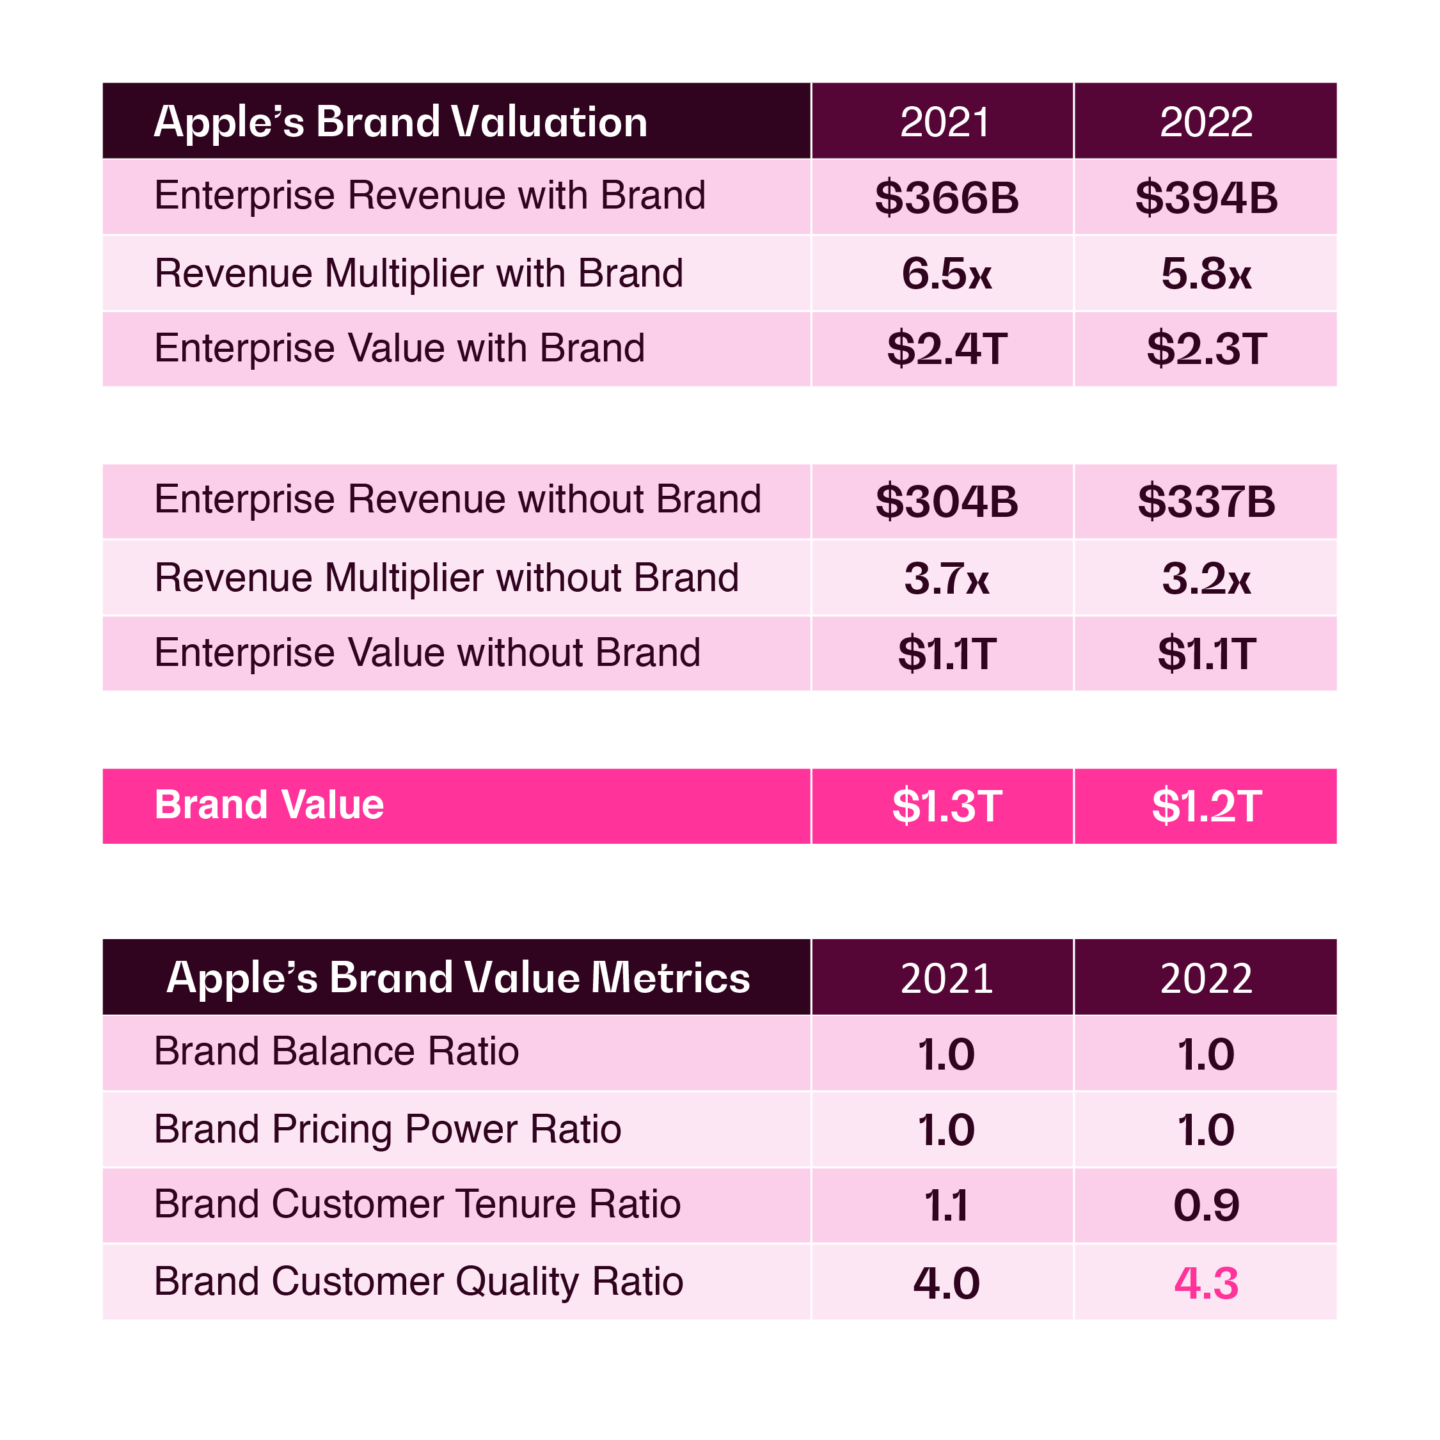
Apple’s enterprise value is $2.3T. $1.2T of that is attributable to the value of the Apple brand (the pink number in the left table above). The remaining $1.1T is due to the value of its other assets, such as factories, warehouses, stores, patents, and working capital. In other words, Apple’s enterprise value would be $1.1T rather than $2.3T if it were just another ho-hum brand.
From an owner perspective, the value of Apple’s brand is mostly due to its contribution to the company’s revenue multiplier because of its impact on the company’s revenue quality. Through a customer lens, this is explained by extraordinarily high loyalty to the brand. As you can see in the table above right, the Apple brand has a customer quality ratio of 4.3, meaning its loyal customers outnumber non-loyal customers by more than four times! Note how this compares to other brands:
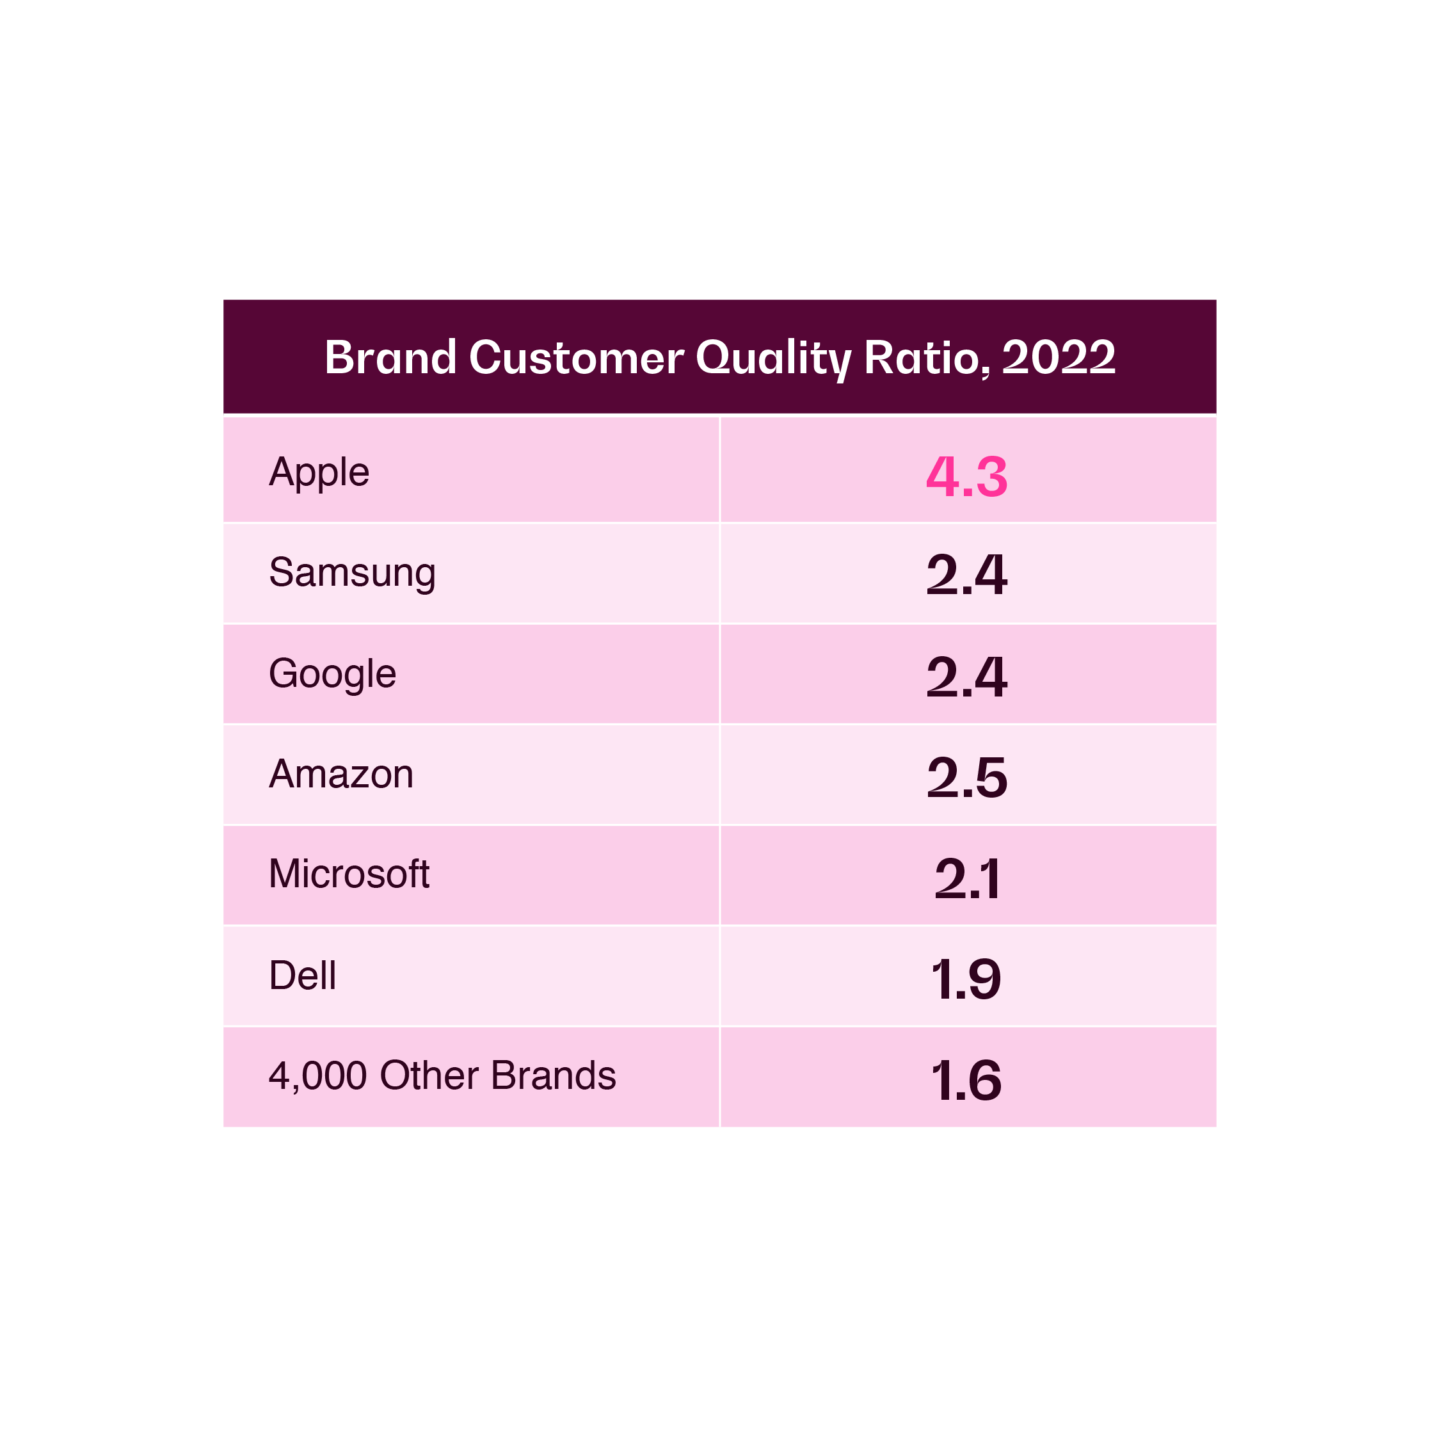
Apple’s customer quality is more than 2½ times the average brand and about double the customer quality of some of the world’s most successful tech brands ever created. That produces fantastic revenue quality, which is why Apple Inc’s revenue multiplier is so high for such a large company.
Brand valuation: what’s in it for you?
Measuring your brand’s value as we recommend here produces an objective, high-resolution measure of brand value and a quantified, objective connection to what’s driving it from an owner and consumer perspective. This gives you the power to make decisions with data and confidence, such as:
- what course-corrections to either our business or brand strategy should we make given the change in our brand valuation over the last year and why it happened?
- why is my brand value in country X and demographic A so much higher than elsewhere, and what does that tell us about how to grow our brand in country Y and demographic B?
- will entering a new category be accretive or dilutive to our brand value? What about exiting a current category?
- in merging two companies or product lines, which path will produce the highest value for the merged entity: going with one of the brands, creating a new brand, or keeping both brands?
Getting brand valuation right takes the guesswork out of big decisions like these, and being able to make such decisions is why measuring the value of your brand can be worth a lot.
Ready for more? Request BERA’s free brand assessment to learn more about how we can help you achieve your brand goals.